
Usually we want to display some information on the screen in a graphic way without a lot of words and with a quick reading. That’s why we use charts. In this post I’ll teach you how to do this.
First of all.. What do I need?
- Add from NuGet Package the plugin: Microcharts.Forms

Let’s Start!
Setting Data Entries to Charts
To begin creating a chart, we need to set some data entries for each one we want to create. Let’s See!
- Floating number indicates the value to represent. (Value required)
- Color indicates the color that will be displayed in our chart.
- Label is the description or legend on the chart.
- ValueLabel is the description or legend in the upper area of the chart, normally it is used to indicate percentages.
And.. What format can I set this data entries in?

What about the XAML?
In the XAML, you have to be set the following namespace:
![]()
Implementation:

Also the chart property can be set that way:
this.chartName.Chart = chart;
Chart Types
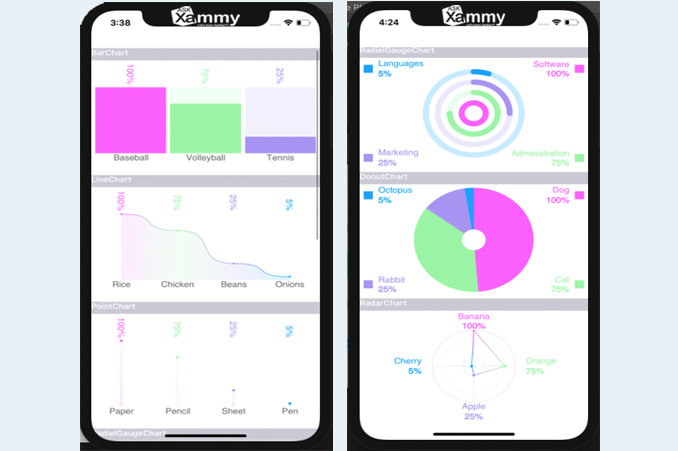
BarChart

This is the BarChart, where we can display our data in a vertical graphical way.
We can implement in one of these ways:
– var chart = new BarChart() { Entries = entries };
– Chart chartName => new BarChart() { Entries = entries }; – (With this way we can pass directly by binding the chart property from the XAML.)
Besides the principal data entries, we can set some properties according to the chart, I’ll show you some of the most important:
- BarAreaAlpha: Allows to increase or decrease the background color intensity of each bar on the BarChart. (This property receives Bytes as data type.)

LineChart

This is the LineChart, which allows to display our data in a graphical line.
We can implement in one of these ways:
– var chart = new LineChart() { Entries = entries };
– Chart chartName => new LineChart() { Entries = entries };
Some additional properties from the chart:
- LineMode: Controls the line design of the LineMode. Supports the following values: None, Spline or Straight.

PointChart

This is the PointChart, which allows to display our data in lines for each group of data.
We can implement in one of these ways:
– var chart = new PointChart() { Entries = entries };
– Chart chartName => new PointChart() { Entries = entries };
Some aditional property from the chart:
- PointAreaAlpha: Allows to Increase or decrease the background color intensity of each bar on the PointChart. This property receives Bytes as data type. (This property is also supported for LineChar and BarChart ).

RadialGaugeChart

This is the RadialGaugeChart, which allows to display our data in circles for each group of data.
We can implement in one of these ways:
– var chart = new RadialGaugeChart() { Entries = entries };
– Chart chartName => new RadialGaugeChart() { Entries = entries };
Some aditional property from the chart:
- LineSize: Sets the line size for the RadielGaugeChart. (This property is also supported for LineChar and RadarChart ).

DonutChart

This is the DonutChart, which allows to display our data in a circle way.
We can implement it in one of these ways:
– var chart = new DonutChart() { Entries = entries };
– Chart chartName => new DonutChart() { Entries = entries };
Some additional properties from the chart:
- HoleRadius: Controls the center hole size for the chart. This property receives Float as data type.

RadarChart

This is the RadarChart, which allows to display our data in a circle with lines.
We can implement it in one of these ways:
– var chart = new RadarChart() { Entries = entries };
– Chart chartName => new RadarChart() { Entries = entries };
Some aditional property from the chart:
- PointMode: Sets the shape of the point in RadarChart and supports the following values: None, Circle or Square. (This property is also supported for BarChart , LineChar and PointChart ).

Some common properties:
- LabelTextSize: Sets the labels size for the chart.
- LabelOrientation: Sets the orientation for the lower label for the chart. (Can be horizontal or vertical).
- AnimationDuration: Sets the duration of the animation for the Chart. (Receives a TimeSpan as a Data Type)
How set this Properties…?

Good luck with your implementation! ?
![]() Click to see an example in my GitHub.
Click to see an example in my GitHub.
Spanish post:
https://xamarinlatino.com/aprendamos-sobre-gráficas-charts-en-xamarin-forms-8388fa9c63c
References:
https://blog.xamarin.com/microcharts-elegant-cross-platform-charts-for-any-app/


Excellent post. Congrats.
Thank you very much dear!
Excellent post, keep it up.
Thank you dear!