

Launching our apps is just the first step; maintaining user satisfaction is the ongoing challenge. After releasing our apps in the store, our primary goal is ensuring this satisfaction by delivering a seamless and relevant experience. Yet, we often lack insights into issues some users may encounter. This underscores the necessity for tools that serve as our eyes, tracking pivotal user interactions and events. Why is monitoring vital? It helps in timely identification and even prediction of potential glitches, enabling us to address them before users report. While various tools offer these capabilities, this article will delve into Sentry, a renowned remote crash reporting tool, discussing its features and step-by-step implementation
The explanation will be divided into the following points:
🔹 What exactly Sentry is?
🔹 Getting started with Sentry implementation
🔹 Initiating the App Monitoring
🔹 Getting Familiar with the Sentry Dashboard
Let ‘s start!
What exactly Sentry is?
It’s an open-source tool designed to track errors within your applications. Sentry monitors any issues arising in your app, offering detailed insights that help prioritize, identify, and reproduce each problem, ensuring a swift and effective resolution. With this tool you can take action on broken lines of code, crashes, and failed API calls.
Getting started with Sentry implementation
To apply Sentry monitoring to your applications, you must do the following steps:
Step 1⃣: Create your Sentry account
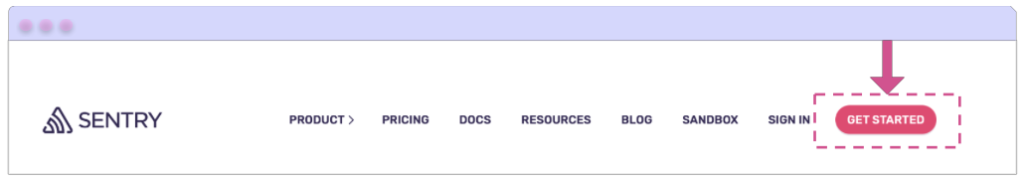
Go to the Sentry site and click on the Get Started button, located at the top right of the page.
You can choose how to register:
- Directly with Sentry: You’ll find a form asking for basic personal information to complete your registration. (✍️ I will use this option for this article.)
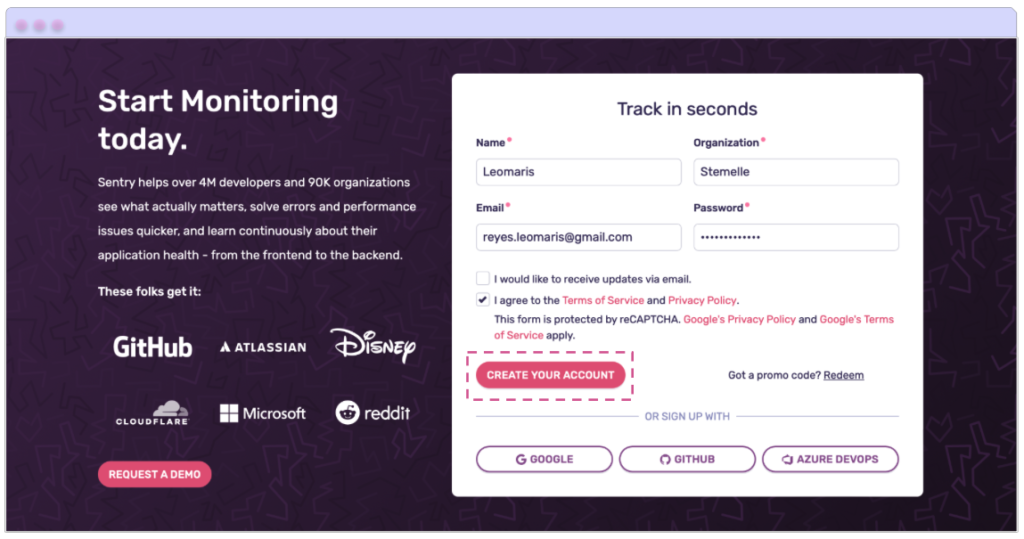
- Via third-party accounts: At the bottom of the form you also have the option to register using your Google, Github, or Azure Devops accounts.
Step 2⃣: Setting up Sentry
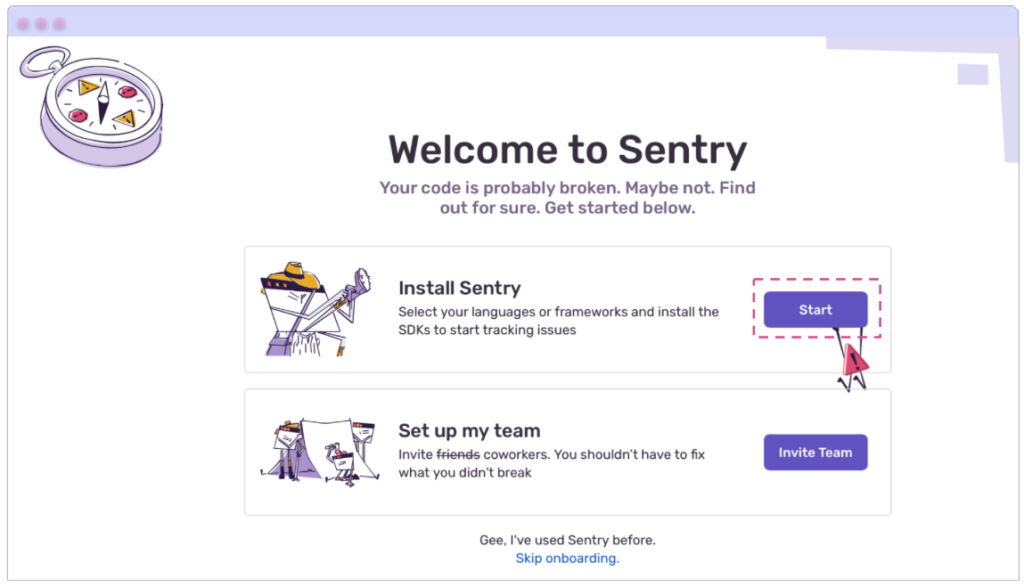
After your account is created, a screen will pop up offering you the choice to install Sentry or set up your team. For now, we’ll concentrate on installing Sentry, please press its Start button.
Choosing the Platform to Monitor
In the next step, you must choose the platform you want to monitor. Sentry provides support for a wide variety, categorized by their main functionalities, such as Desktop, Web, Mobile, among others. The detailed list can be seen in the attached animation. To reach this article, you will navigate to the Mobile tab and select .NET Multiplatform App UI (MAUI).
Once you have selected the platform you are going to work with, click the Configure SDK button located at the lower right corner of the page.
Configuring your MAUI SDK
Sentry details every necessary step for its integration into your application: from the necessary Nuget package to initialization and implementation. It even offers a sample application. This information is essential for your setup, so make sure to keep it handy; you will need it in the next steps.
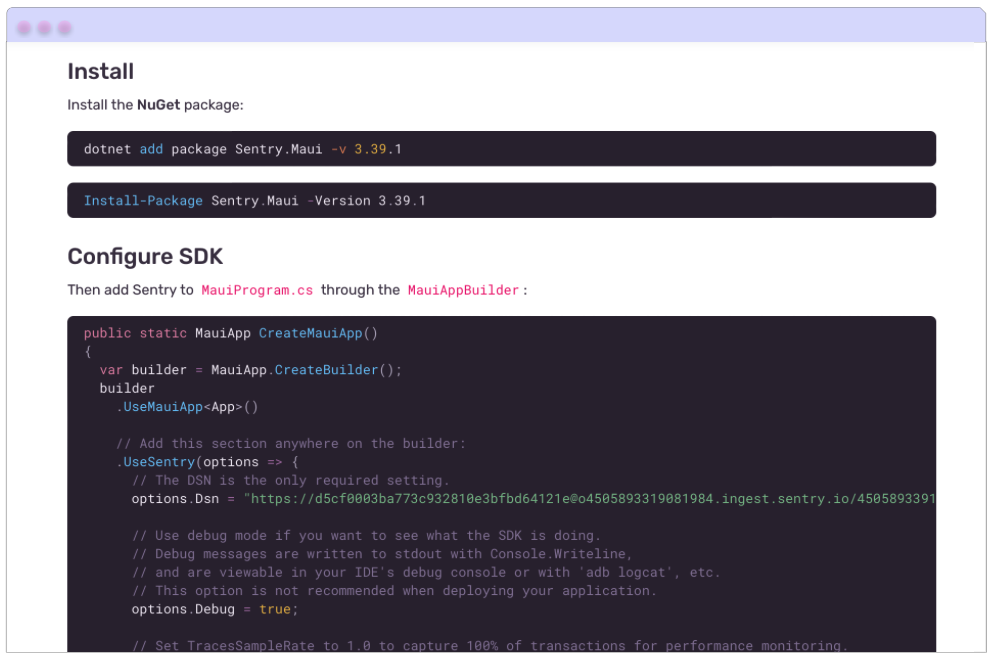
⚠ Save the DSN endpoint that this step shows you; you’ll need it for the Visual Studio implementation.
Step 3⃣: Implementing Sentry in our MAUI App
Open your MAUI project in Visual Studio. For this demonstration, I created one named “SentrySample”.
🔧 Initial setup
➖ From the NuGet Package, add the Sentry.Maui package to your project.

➖ Go to your MauiProgram.cs file
In the CreateMauiApp method, find the .UseMauiApp<App>() line. Right below it, add UserSentry(). This function has various useful overloads to explore. However, in this article, we will focus on the one that uses a DSN as a parameter.
What is the DSN?
The DSN (Data Source Name) in Sentry acts as a distinctive identifier for the data source of a specific project. It facilitates the direct linking of events from your application to the corresponding Sentry project. This “address” instructs Sentry on how to organize and store incoming data. Essentially, it guarantees that error and performance metrics from your application are correctly channeled to the right project within your Sentry account.
Let’s implement it in code
Do you remember the endpoint DSN saved in the previous step? Add it in this method.
Initiating the App Monitoring
With your initial configuration in place, you’re all set to begin monitoring the various events and scenarios in your app.
Where should you start with your monitoring? Here’s my recommendation:
🔹 Begin with a pre-established document outlining the specific events or scenarios you want to track.
🔹 Assign unique identifiers for each scenario within this document. It’s essential to use clear and intuitive naming so it’s easily understandable to anyone reviewing it. For instance, if you aim to track when a user logs in via Facebook, a potential identifier might be “facebook_login,” accompanied by pertinent data like the user’s name and email.
Exploring App Monitoring available methods
Now that our monitoring scenarios are set up, let’s dive into the various methods provided by the SentrySdk. In this guide, I’ll introduce you to some of the main Sentry methods:
➖ CaptureMessage
While Sentry SDKs don’t auto-capture messages, this method enables manual submission of textual information to Sentry, enhancing monitoring precision.
It receives the following parameters:
🔹 Message: Is the message to send. – Receives a string as a value – [Mandatory]
🔹 SentryLevel: Allows you to define the level of severity or importance of the event that is sent to Sentry. It’s important to specify the appropriate level, as it allows us to ensure that messages are prioritized and categorized correctly within the Sentry system. [Optional]
It’s an Enum that contains the following values:
▪ Debug: Offers insights for debugging purposes, detailing the inner workings or state of the system.
▪ Info: Provides general informational messages that signify normal, non-error events.
▪ Warning: Flags potential problems or unusual occurrences that don’t currently impact functionality but may do so in the future.
▪ Error: Highlights a significant issue, which though not fatal, may impede functionality.
▪ Fatal: Indicates a critical error that might cause the system to terminate.
How can we implement this in code?
➖ CaptureException
Enables you to capture exceptions that arise within your app.
🔹 Exception: Capturers a exception. – [Mandatory]
🔹 Configure scope: It allows you to define a specific context for exceptions that you forward to Sentry. In your report, you can include details such as the severity of the error and assign specific tags, among others. I will provide an example that showcases some essential configurations, and we invite you to further explore its capabilities.
➖ CaptureEvent
Allows you to capture the monitoring of an event. This method accepts data of the SentryEvent type. You can include various essential details for your monitoring, such as the error level, a message, and more. I encourage you to delve deeper into its features.
How can we implement it in code?
We have explored some of the main methods. I invite you to continue delving deeper into others.
⚠ Some of these methods necessitate capturing detailed user information, like their email or name. In such cases, it’s crucial to inform the user about the collection of their data.
Getting Familiar with the Sentry Dashboard
At last, you’ll discover where to view all the data you’ve been monitoring! Let’s start with a straightforward example: capturing a message that we’ll then observe on the Sentry Dashboard.
Creating the example
I’ll demonstrate using the default .NET MAUI application as an example. Head to MainPage.xaml.cs—I’ll be working with the built-in counter code. Further, we’ll incorporate Sentry’s CaptureMessage function, as outlined below:
To get information for Sentry, it’s important that you run the application and click the counter button.
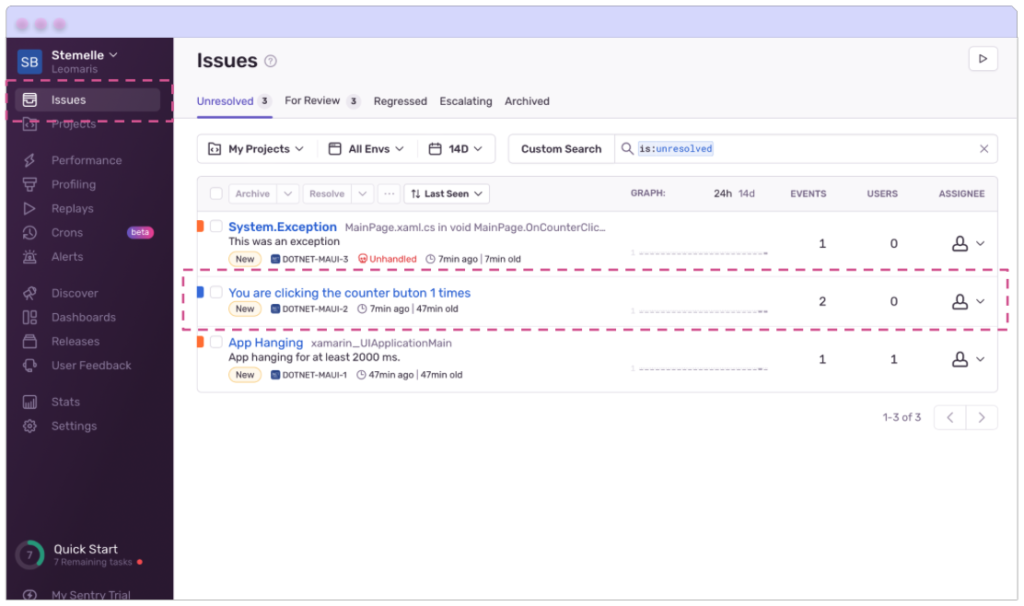
Entering to the dashboard
In your Sentry Dashboard, navigate to Issues. A list of your monitoring records will promptly display. While other examples might appear in this segment, let’s concentrate on the entry we generated earlier—highlighted with pink lines—that reads, “You clicked the counter button 1 time”.
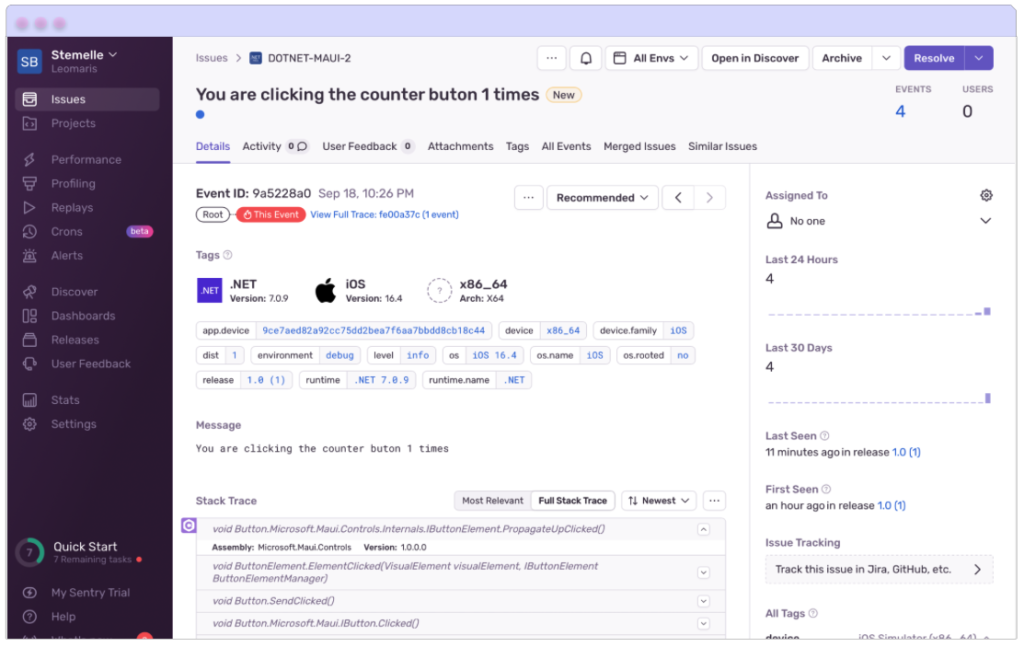
Click on the highlighted item. On this page, you can view the record’s comprehensive details, including the name of the originating application, the .NET version in use at the time of the record’s creation, the operating system version, and of course, the message you sent, among others information. There is a wealth of crucial information here that warrants your attention and that will allow you to make decisions in your app. Scroll through to take it all in!
Here’s a glimpse of what it looks like:
🚀 Voilà! You’re now all set to monitor your .NET MAUI applications with Sentry. Keep building awesome apps and enjoy the peace of mind Sentry provides! 📖🙌
Spanish post:
References:
Thanks for reading my article! 💚💕

I love this blog post! I’m a big fan of Sentry and I’m looking forward to trying it out on my .NET MAUI apps.